I have to start with a disclaimer – I’m not a specialist in wind resource analysis.
However, through the year I’ve seen several time this process so I think I can summarize it with a reasonable level of accuracy (and obviously if you spot a mistake, please let me know).
The wind resource assessment is done for several reason: to define the most suitable wind turbine given the local meteorology, to define the layout of the wind farm and, above all, to calculate the expected energy production of the wind farm – which is obviously a key input in the calculation of the profitability of the project.
To calculate the wind resource you will need to measure several variables:
- Wind speed
- Wind direction
- Wind shear
- Wind turbulence
- Air density
- Roughness of the area
This variables are usually measured installing one or more meteorological mast (“met mast”) in the area where the wind farm is planned – obviously with the exception of the roughness, which is assessed by a specialist keeping into account the topography and the vegetation of the area.
This activity is called “site measurement campaign”.
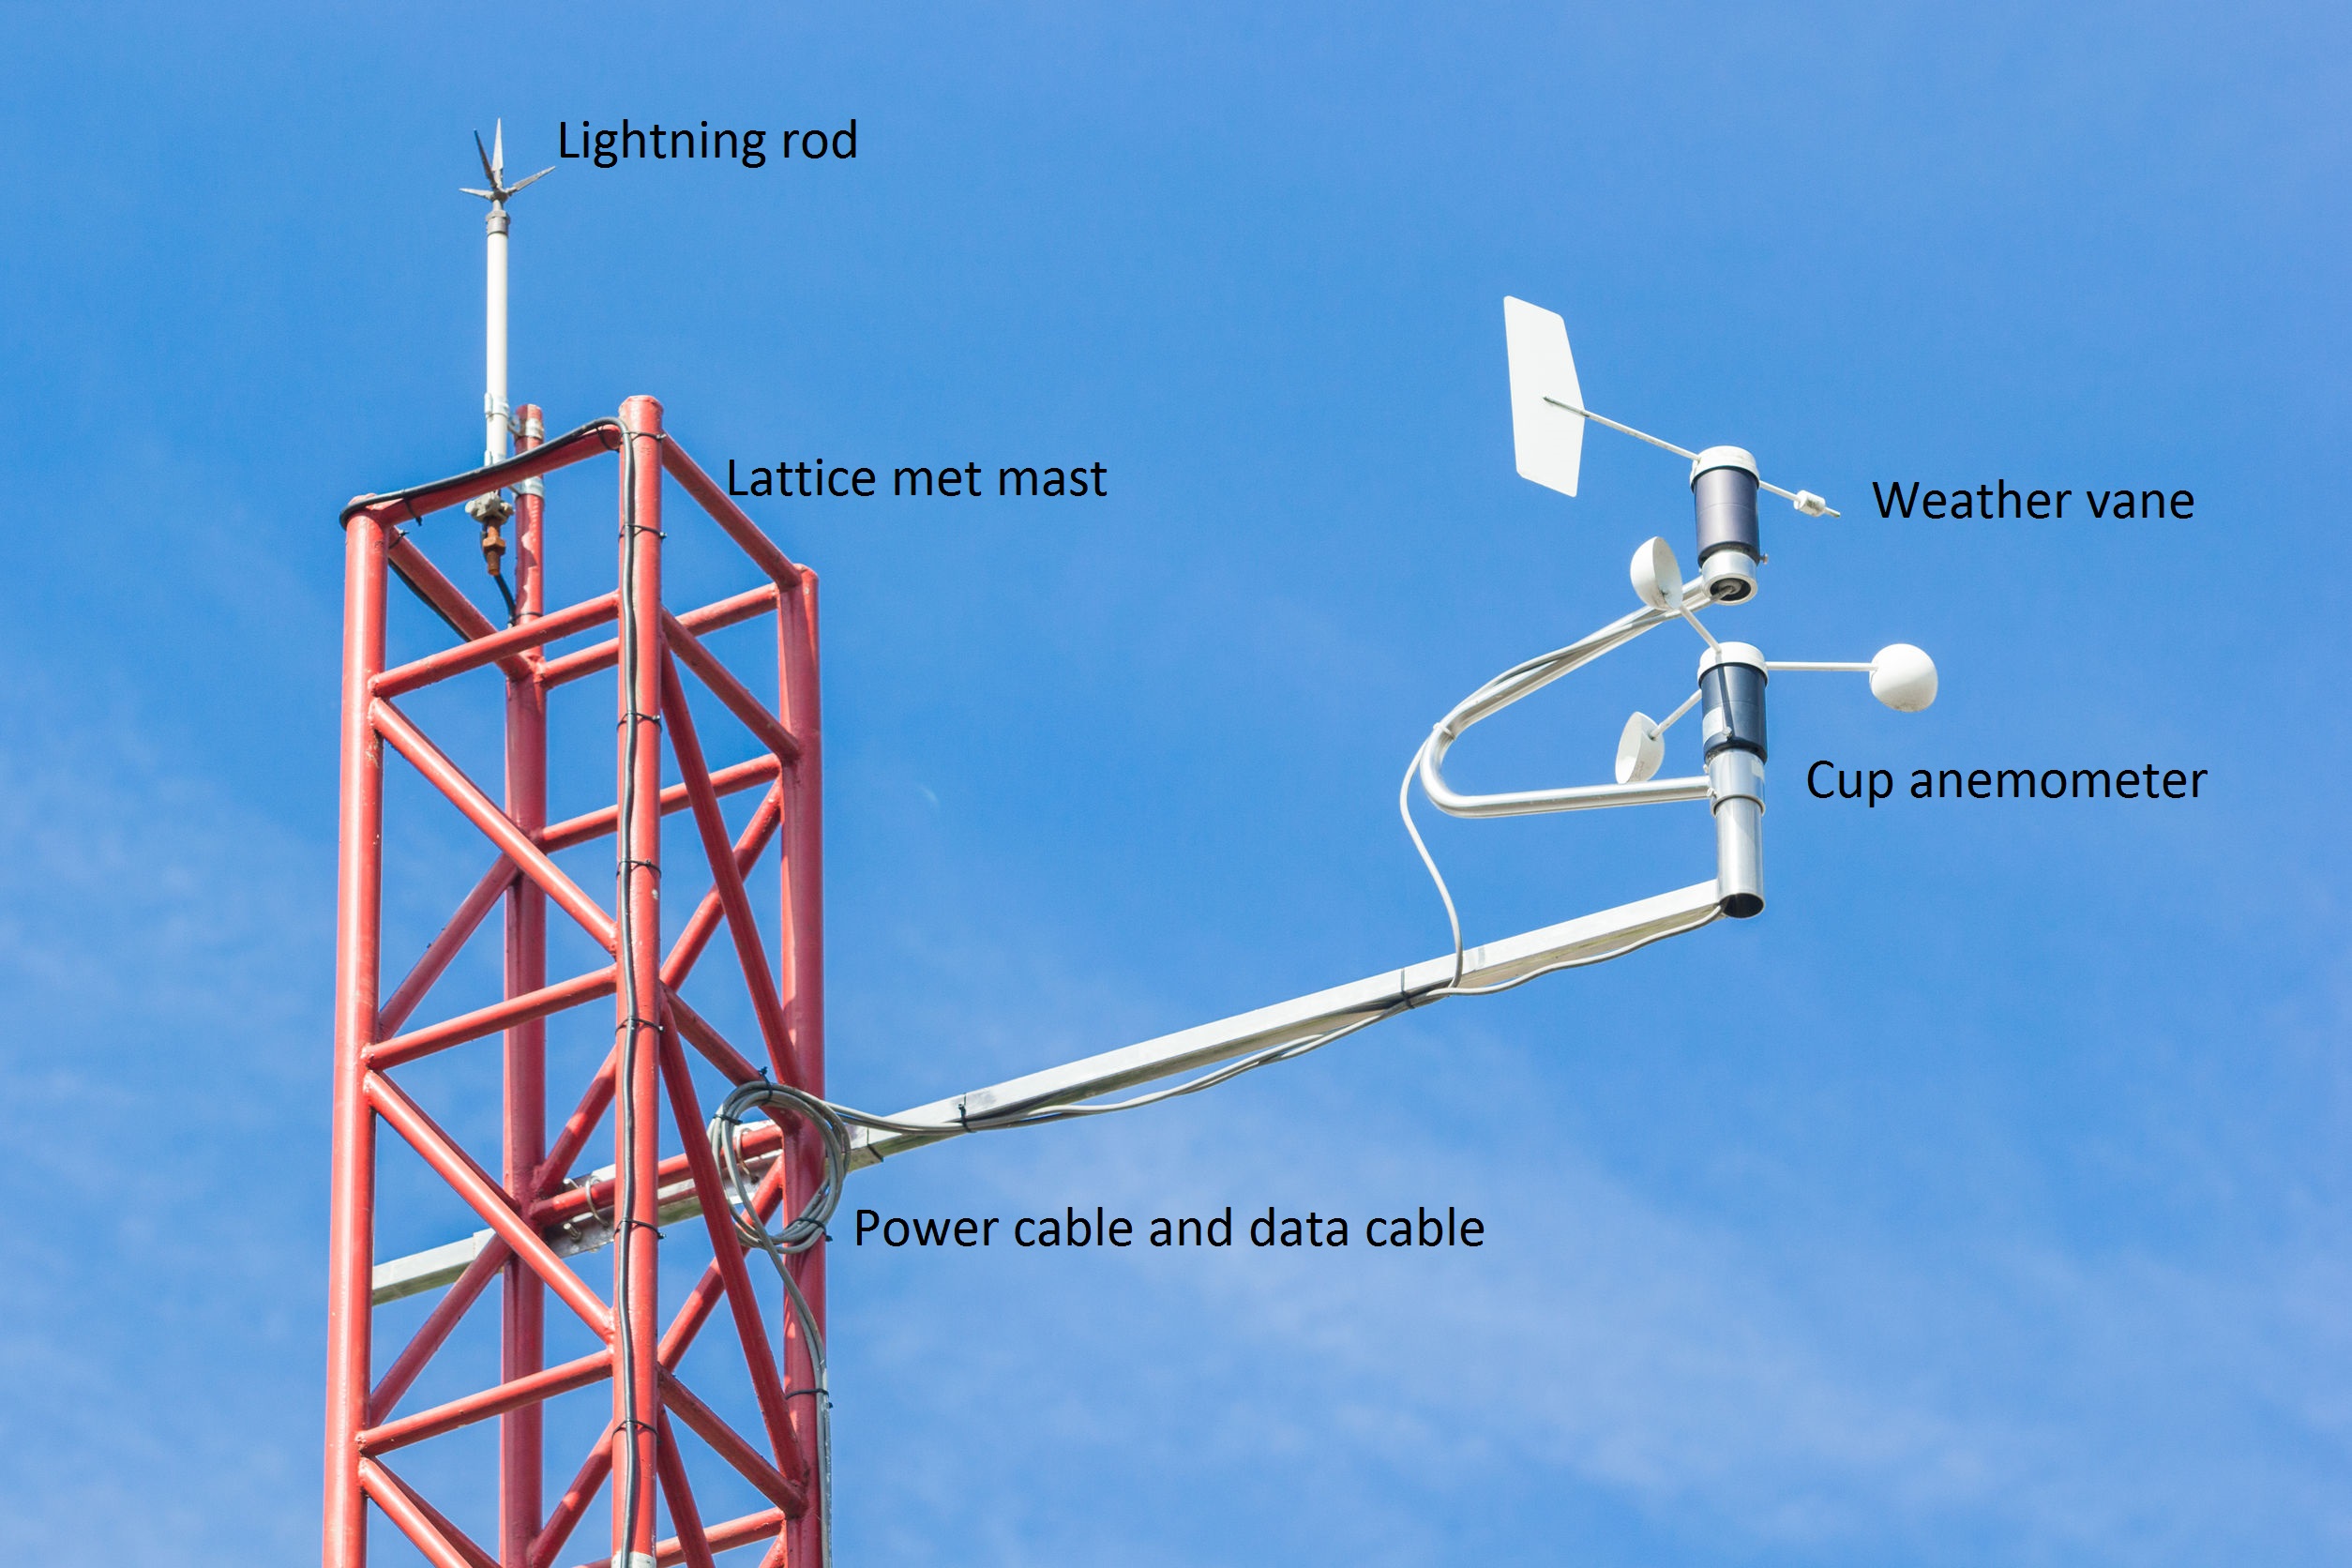
The met mast is a tower made of steel (or, more unusually, in concrete) where the measuring equipment is installed. Ideally the met mast should have the same high of the wind turbines that are going to be installed in the area – however, to save money sometimes shorter masts are used.
The equipment installed on the met mast include usually the following:
- Anemometers (usually there are several anemometers at different heights)
- Weather vane (to record the direction of the wind)
- Barometer
- Thermometer
All the information collected is safely stored in an element called “data logger”. Auxiliary elements in a met mast are solar panels, a protective lightning rod on top, anti-vandalism fence and obviously the foundation.
Ideally, at least 1 year of data should be recorded. However longer measurements (2 to 5 years) have less uncertainties and capture better the seasonal and intraday variability of the wind in the area.
After the site measurement campaign the wind resource assessment start.
The first step is to “clean” all records before processing, removing errors that can occur due to malfunctioning of the instruments.
After, several key parameters are defined:
- Mean speed
- Wind rose
- Wind speed distribution
- Wind shear
- Wind turbulence
- Air density, pressure, temperature
The last step is to use this parameters to estimate electrical power production. There are quite a lot of commercial software in the industry, being some of the most widely used WAsP, WindPRO and OpenWind .
This software will try to optimize the wind farm layout to maximize energy production considering certain limitations – for instance, they will leave a distance of at least 6 rotors from one wind turbine to the other in the direction parallel to the wind.
Finally, when the layout is defined, the software will combine the power curveof the WTG with the wind speed distribution of the site to have the power output.
Leave a Reply