Behind every wind farm project there is a technical feasibility study, made to assess the potential for electricity generation of the selected site.
At the beginning of the wind farms era wind speed and wind direction was estimated using data from existing weather stations.
Due to large differences between predicted energy production and actual generated energy (which was usually overestimated) meteorological met mast are now designed and installed to have better estimates.
Any estimate of the Annual Energy Production (AEP) contains several uncertainties and paramethers that can vary such as:
| Measurement Campaign | Duration, tower setup, anemometer quality. |
| Long term adjustments | Selection of a long term wind data source, correlation and long term prediction methodology. |
| Flow model | Linear model, computational fluid dynamics models, mesoscale for estimation from met mast into none measured positions. |
| Horizontal and vertical extrapolation | Horizontal and vertical distance from the meteorological mast(s) to each Wind Turbine Generator (WTG) position and hub height. |
| Wind speed to energy | Use of a wind turbine calculated/measured power curve together with the site conditions wind speed to estimate energy (if within constrain inflow angle, wind shear, etc). |
| Technical losses | Calculated losses i.e. electrical, environmental, curtailment, wake model selection. |
Giving all these project uncertainties, an AEP can be calculated with different levels of confidence in the results.
For instance, what is called a “P50” is a production expected to materialize in 50% of the cases.
It is possible to estimate more conservative energy productions, such as for example P99 (a lower production value, that should materialize in the 99% of the situations).
The wind site resource assessment is a careful identification and evaluation of different risks and uncertainties sources that are unique for each site.
In this article we will focus on two uncertanties, arising from the horizontal and vertical extrapolation of data.
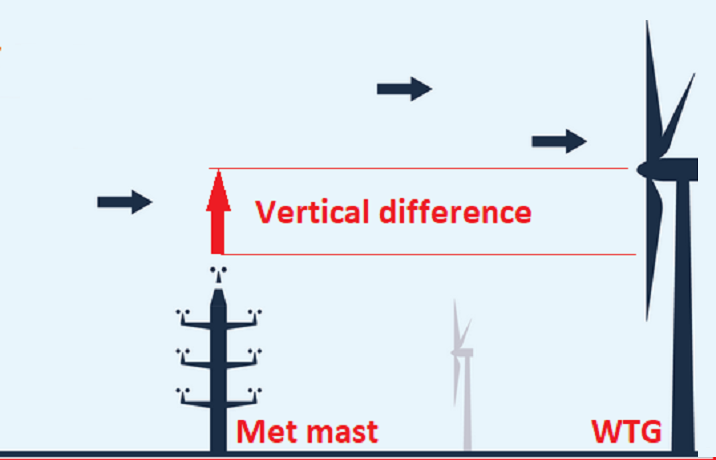
For the vertical extrapolation we can identify two sources of uncertanties:
The difference between measurement height and hub height.
When using a lower met mast compared to the selected WTG hub height different methods can be used to estimate the wind speed either by extrapolating for example with a power law/log law method.
The altitude difference (flow model)
It is possible to reduce the first vertical uncertainty by installing a met mast with a top anemometer at the same hub height.
Alternatively remote sensing devices such as a Sodar/Lidar can be used on site.
It is recommended to have a wind speed measurement of at least 2/3 of hub height to keep uncertainties at an acceptable value, as any methods for hub height wind speed estimation (i.e. power law or flow model) will add uncertanty to the calculation.
A typical range for this uncertainty is in the 1 to 4% range, varying depending on the type of terrain and the total vertical distance (for example, 0.5% per every 10 meters vertical difference).

The Horizontal Extrapolation is heavily influenced by the terrain and surrounding vegetation.
Measnet (Evaluation of Site-Specific Wind Condition V2 April 2016) recommends different maximum distances between measurement position and wind turbine generator (WTG) for a simple and complex terrain.
One of the reasons is that certain orographic traits (plain, rolling hills, mesas, mountain ridges) and roughness (native vegetation, agricultural, forest, lakes) at the measurement position should be “similar” to the WTGs position for the flow to behave in the same manner.
A typical range for this uncertainty is from 1 to 4%.
According to Measnet the data from a met mast are representative only for few km – up to 10km for a simple terrain and around 2km for a much more complex terrain.
After the assessment of 200 projects DNV-GL identifies the horizontal and vertical extrapolation to be responsible for approximately 35% of the total energy uncertainty.
For projects with a high spatial variation (i.e. with turbines very far away from each other) the value can be as high as 51%.
More information on the topic can be found here: Reducing Uncertainty in Wind Project Energy Estimates with Triton
Depending on the wind farm total size, terrain characteristics and mesoscales effects this values can be even higher.
It interesting to note that even if two projects have the same P50 AEP, the one with lower uncertainties and therefore a higher P99 AEP will have better chances to be built being more “bankable”.
Conclusion: very early in the project, after just a few months of measurements, the Horizontal and Vertical uncertainty should be calculated and simulated in cost to benefit financial model to find out the best quantity of measurement locations to have.
A factor to consider this important topic in the initial period is to be able to carry out correlation between measurement locations and assess flow model cross-prediction errors that will further reduce project uncertainties.
Leave a Reply